Gene Expression Browser
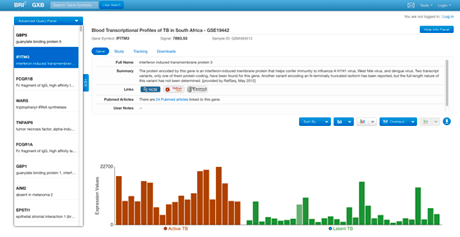
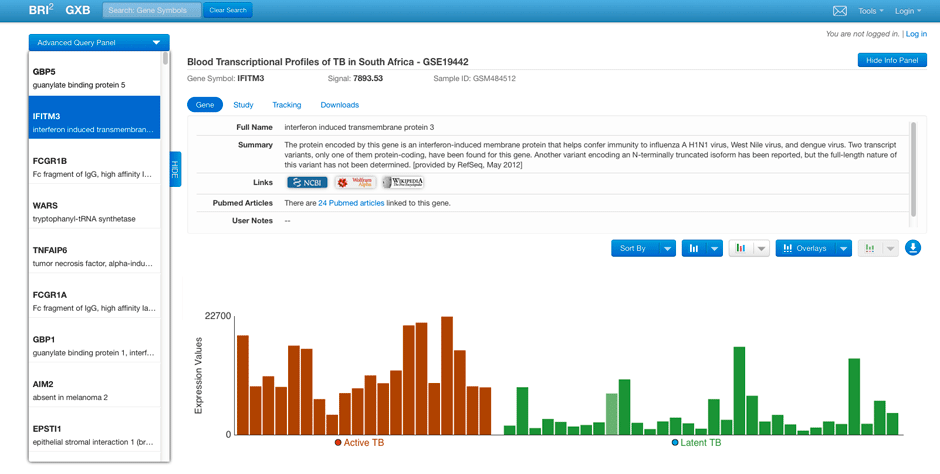
In the GXB, you can view the expression level of all genes in your dataset, overlay the clinical data associated with the samples, and rank the genes, either using pre-defined lists or dynamically.
Each bar in the histogram represents the expression level in a single sample from the dataset for the highlighted gene.
Go to the FAQ at the bottom of the page.
GXB FAQ:
Can we get a p-value instead of a fold change with our rank lists?You can’t rank by p-value in the current version of the GXB. However, you can rank by fold change, a difference, or both.
The graph is rather small, what screen sizes do you support and how can I view the graph in more detail?
The GXB is optimized for screens 1024px wide or larger; it will still be viewable on smaller screens, but you will have less of an overview.
You have the option of hiding either the Gene List panel, or the information tabs, or both in order to let the graph take up a larger
percentage of the screen.
How can I change rank list?
There are options for rank lists in the panel called "Advanced Query Panel" on the top left. If
you would like even more options, click "Change Rank List" under Advanced in the top right of the screen.
Where can I find a key for the overlay legend?
When you have selected at least one overlay option, you may click the Overlay Legend Button; a key to the overlays will
become visible. You can also choose to download the key as an image.